Dynamic Dashboards allow Epicor E10 users to turn any BAQ into a dashboard. You may be saying to yourself, “Epicor already has dashboards, whats the difference between the build in dashboard module and aPivot’s dashboard module?”
aPivot dashboards are accessible from any device with a browser. Our module includes the following reporting features:
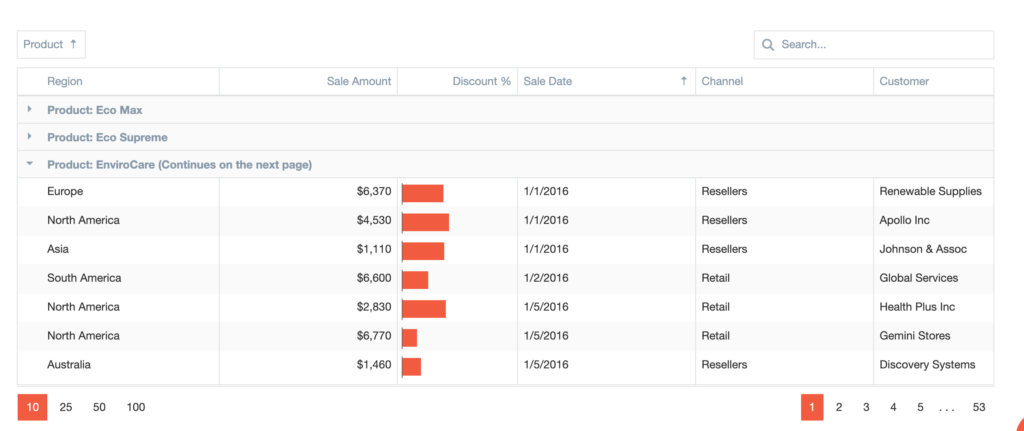
Data Grid: The Data Grid is built for speed and ready to tackle your toughest business challenge. With integrated server-side support for data filtering, paging, sorting, record grouping, and summary computations extremely large datasets are never an issue.
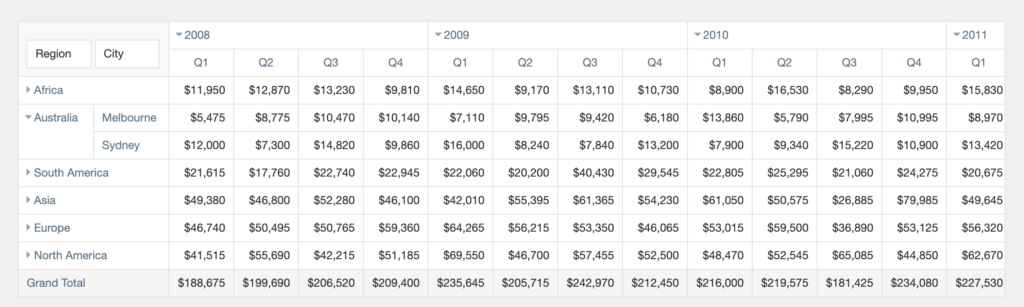
Pivot Grid: The HTML5 JavaScript Pivot Grid is a feature-rich client-side widget optimized for multi-dimensional data analysis and ships with a rich set of runtime customization options so you can quickly summarize business trends via its cross-tabular display format.
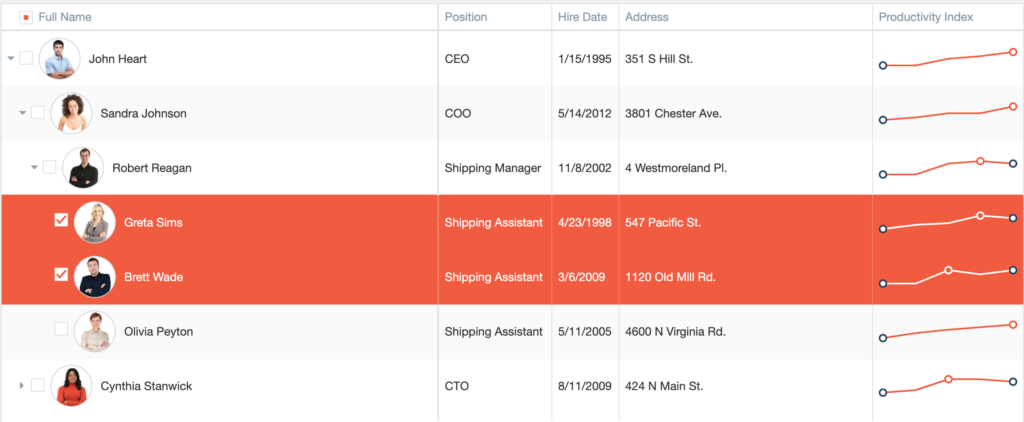
Tree List: The HTML5 Tree List widget can consume data. The flexibility of the Tree List is such that you do not need to feed it hierarchical data structures. Even with a collection of linked plain objects, the Tree List can still build a tree hierarchy.
Mapping: The HTML5 JavaScript Map provide interactive maps that can be populated with data.

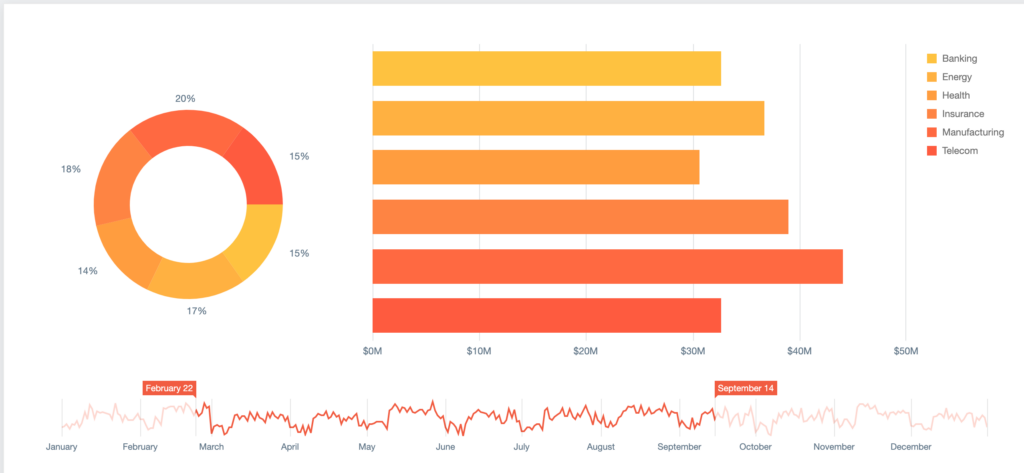
Charts: From next-gen websites, to those targeting mobile devices, we brings a fully integrated collection of high-performance data visualization widgets for all your business intelligence needs.
Version Features:
- aPivot Dynamic Dashboards
- General
- Mapping to a BAQ
- Maps BAQ headers to business object fields
- Ability to save, edit and delete mappings
- Dashboard options
- Multiple dashboard output options
- Data Grid
- Pivot Grid
- Tree List
- Mapping
- Charts
- Multiple dashboard output options
- Save Report styles by User
- Save your report style output for repeated use.
- Export data to excel
- Mapping to a BAQ
- General
- Contact us today for a demo:
